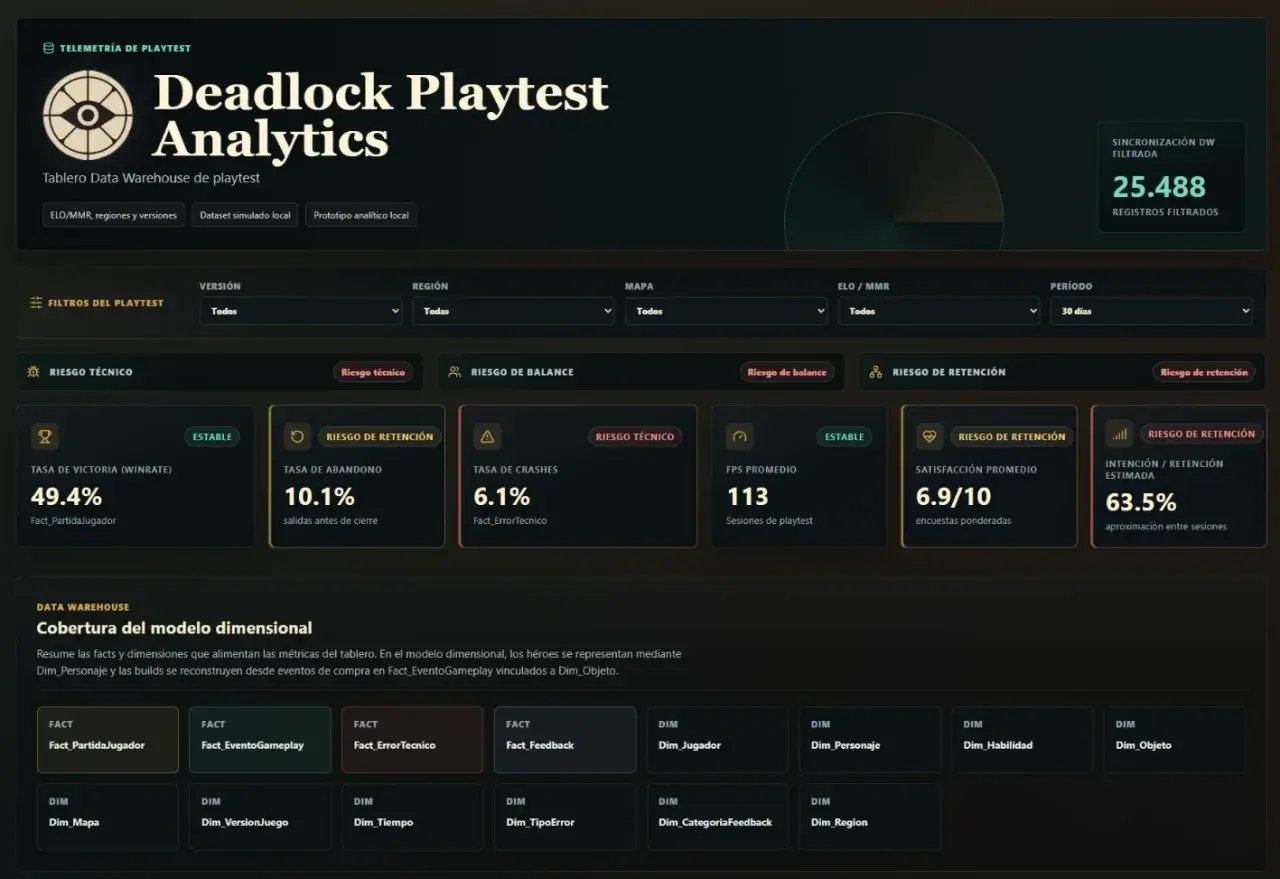
Data, calculations and presentation
Local TypeScript datasets feed filtering and aggregation functions; React and Recharts present the results. Retention and predictive views remain simulated, without validated predictive models.
From a dimensional model to an analytical view.
Explore matches, balance and player experience through a dimensional model.
React/TypeScript dashboard with filters, indicators and charts over locally simulated datasets. An independent prototype, not an official Valve or Deadlock tool.
Explore how facts and dimensions can feed playtest indicators and comparisons.
I worked on the analytics prototype, adjusting dashboard visualization, correlation and terminology, and documenting its simulated datasets.
Local TypeScript datasets → filtering and aggregation functions → dashboard model → React and Recharts components. Match, event, error and feedback facts relate to hero, version, map and region dimensions.
Local TypeScript datasets feed filtering and aggregation functions; React and Recharts present the results. Retention and predictive views remain simulated, without validated predictive models.
Version, region, map, range and period act as common dashboard criteria. Consistent indicators depend on keeping these filters and aggregates aligned.
Keep filters, aggregates and indicators coherent, and distinguish the dimensional model from real ingestion. The prototype has no backend or telemetry pipeline.
Local dashboard with filters and visualizations over a fact-and-dimension model. Its indicators use simulated data; predictions have not been validated against real-player data.